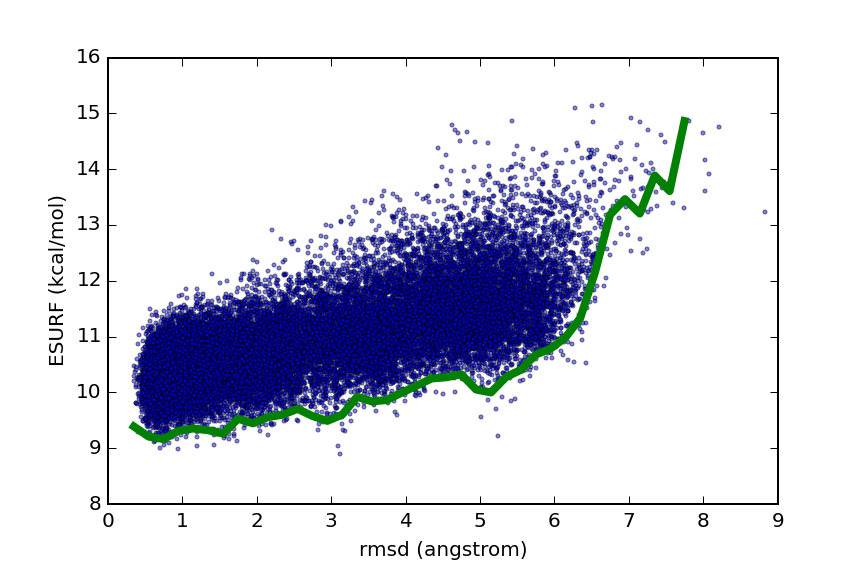
Lowest curve plot below data cloud
try pytraj online:
In [1]:
! head esurf_vs_rmsd.dat
In [2]:
import warnings
warnings.filterwarnings('ignore', category=DeprecationWarning)
import pytraj as pt
import numpy as np

# load energy and rmsd data
data = np.loadtxt('esurf_vs_rmsd.dat').T
data
Out[2]:
In [3]:
lowest_data = pt.lowest_curve(data, points=10, step=0.2)
# skip final data points to have  nicer plot
lowest_data = lowest_data[:, :-5]
lowest_data
Out[3]:
do plotting
In [4]:
%matplotlib inline
%config InlineBackend.figure_format = 'retina'  # high resolution
import matplotlib
matplotlib.rcParams['savefig.dpi'] = 2 * matplotlib.rcParams['savefig.dpi'] # larger image
In [5]:
from matplotlib import pyplot as plt

plt.plot(data[0], data[1], 'o', markersize=2., alpha=0.5)
plt.plot(lowest_data[0], lowest_data[1], linewidth=4.)
plt.xlabel('rmsd (angstrom)')
plt.ylabel('ESURF (kcal/mol)')
#plt.savefig('lowest_curve.png')
Out[5]:

(basic_tutorial_lowestcurve.ipynb; basic_tutorial_lowestcurve_evaluated.ipynb; basic_tutorial_lowestcurve.py)