Five minute learning
try pytraj online:
# load pytraj
In [1]: import pytraj as pt

# load amber netcdf file
In [2]: traj = pt.iterload('tz2.nc', 'tz2.parm7')

In [3]: traj
Out[3]:
pytraj.TrajectoryIterator, 101 frames:
Size: 0.000503 (GB)
<Topology: 223 atoms, 13 residues, 1 mols, non-PBC>


# perform analysis
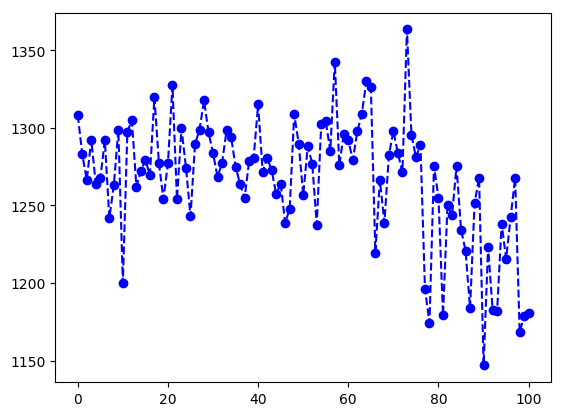
In [4]: data = pt.molsurf(traj, mask='!@H=')

In [5]: data
Out[5]:
array([ 1308.2065,  1282.9388,  1266.4465, ...,  1168.2444,  1178.7029,
        1180.74  ])

# plotting
# write to disk in DCD format
In [6]: pt.write_traj('charmming.dcd', traj, overwrite=True)

In [7]: from matplotlib import pyplot as plt

In [8]: plt.plot(data, '--bo')
Out[8]: [<matplotlib.lines.Line2D at 0x113b19b70>]
