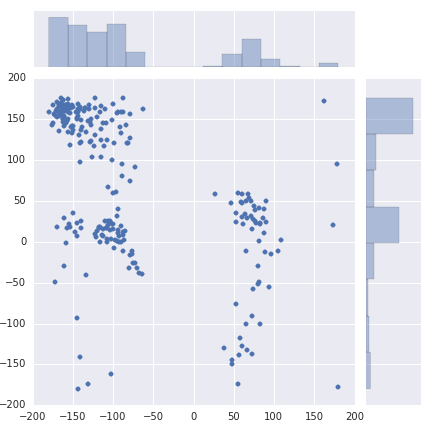
Ramachandran plotΒΆ

try pytraj online:

http://mybinder.org/badge.svg

../_images/phipsi_ala3.png

Aim 1

  • download pdb file
  • calculate phi/psi for specific residue
  • show ramachandran plot
In [1]:
import warnings
warnings.filterwarnings('ignore', category=DeprecationWarning)

# do some configs to get better plot
%matplotlib inline
#%config InlineBackend.figure_format = 'retina'
import matplotlib
#matplotlib.rcParams['savefig.dpi'] = 2 * matplotlib.rcParams['savefig.dpi'] # larger image
from matplotlib import pyplot as plt

import numpy as np
import pytraj as pt
In [2]:
traj = pt.datafiles.load_trpcage()
print(traj)
print(set(res.name for res in traj.top.residues))
pytraj.TrajectoryIterator, 38 frames: 
Size: 0.000258 (GB)
<Topology: 304 atoms, 20 residues, 1 mols, non-PBC>
           
{'SER', 'TYR', 'ILE', 'PRO', 'ASP', 'ASN', 'GLY', 'LYS', 'TRP', 'ARG', 'GLN', 'LEU'}
In [3]:
# calculate phi/psi for Gly residues
# need to get indcies of Gly residues
indices = [idx for idx, res in enumerate(traj.top.residues) if 'GLY' in res.name]
print('Gly resdiue indices = ', indices)

dataset = pt.multidihedral(traj, 'phi psi', resrange=indices)
print(dataset)
Gly resdiue indices =  [9, 10, 14]
<pytraj.DatasetList with 6 datasets>
phi:10
[ 110.78404243  107.09437321  108.32961461 ...,  115.32072427  162.43037555
  124.30632007]

psi:10
[  8.0792315   10.33861693  -2.0464667  ...,   5.3940854   29.34859639
   8.88098636]

phi:11
[ 55.24421349  58.27147563  60.77040425 ...,  55.64499342  51.45490984
  57.23888395]
...

phi:15
[ 67.93146641  75.78677981  75.05149804 ...,  74.12510912  79.94314603
  69.51439433]

psi:15
[ 25.21773873 -37.51912045 -31.48955407 ..., -30.50312997 -35.73264016
  20.40992958]
In [4]:
# take data for 'phi' and flatten to 1D array
phi = np.array([d.values for d in dataset if 'phi' in d.key]).flatten()

# take data for 'psi' and flatten to 1D array
psi = np.array([d.values for d in dataset if 'psi' in d.key]).flatten()

# setup color
colors = np.random.rand(len(psi))

plt.xlim([-180, 180])
plt.ylim([-180, 180])
plt.xlabel('phi')
plt.ylabel('psi')
plt.grid()
plt.scatter(phi, psi, alpha=0.5, c=colors)
Out[4]:
<matplotlib.collections.PathCollection at 0x10a5292e8>

Aim 2: plot phi/psi for Ala residue

In [5]:
traj = pt.iterload('ala3.dcd', 'ala3.psf')
print([res.name for res in traj.top.residues])
['ALA', 'ALA', 'ALA']
In [6]:
traj
Out[6]:
pytraj.TrajectoryIterator, 256 frames: 
Size: 0.000240 (GB)
<Topology: 42 atoms, 3 residues, 1 mols, non-PBC>
           
In [7]:
# only plot for residue 2 (python uses 0-based index)
phi, psi = pt.multidihedral(traj, resrange=[1,], dhtypes='psi phi')
phi, psi
---------------------------------------------------------------------------
TypeError                                 Traceback (most recent call last)
<ipython-input-7-357dc83675db> in <module>()
      1 # only plot for residue 2 (python uses 0-based index)
----> 2 phi, psi = pt.multidihedral(traj, resrange=[1,], dhtypes='psi phi')
      3 phi, psi

/Users/haichit/miniconda3/lib/python3.5/site-packages/pytraj/utils/decorators.py in inner(*args, **kwd)
      9     @wraps(f)
     10     def inner(*args, **kwd):
---> 11         return f(*args, **kwd)
     12 
     13     inner._is_parallelizable = True

/Users/haichit/miniconda3/lib/python3.5/site-packages/pytraj/utils/get_common_objects.py in inner(*args, **kwargs)
    304                         except IndexError:
    305                             args.append(mask)
--> 306             return f(*args, **kwargs)
    307 
    308         inner._is_super_dispatched = True

TypeError: multidihedral() got an unexpected keyword argument 'dhtypes'
In [8]:
from matplotlib import pyplot as plt
import seaborn as snb
In [9]:
snb.jointplot(phi, psi, kind='scatter', stat_func=None)
#plt.savefig('phipsi_ala3.png')
Out[9]:
<seaborn.axisgrid.JointGrid at 0x10e32a710>

(plot_phi_psi_trpcage.ipynb; plot_phi_psi_trpcage_evaluated.ipynb; plot_phi_psi_trpcage.py)