try pytraj online:
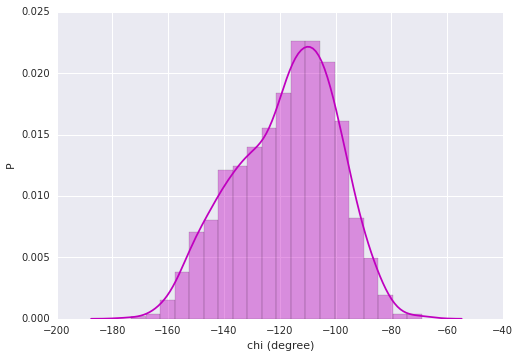
Nucleic acid torsion angle distribution

In [1]:
%matplotlib inline

# need: matplotlib, seaborn
# how? `conda install matplotlib seaborn`
In [2]:
# for this example, we only compute chi value for first 1000 frames
traj = pt.iterload('GAAC3.5000frames.nc', 'GAAC.topo', frame_slice=(0, 1000))
traj
Out[2]:
In [3]:
chi = pt.calc_chin(traj, resrange=[10,], dtype='ndarray')
chi
Out[3]:
In [4]:
# plot time series
from matplotlib import pyplot as plt

# turn off warning for pretty notebook
import warnings
warnings.filterwarnings('ignore')

plt.plot(chi)
plt.xlabel('frame number')
plt.ylabel('chi (degree)')
Out[4]:
In [5]:
# Distribution plot
# require: seaborn, statsmodels
import seaborn as sb

# Plot a historgram and kernel density estimate
sb.distplot(chi, color="m")
plt.ylabel('P')
plt.xlabel('chi (degree)')
Out[5]: