try pytraj online:
Radial distribution function of waters
In [1]:
import warnings
warnings.filterwarnings('ignore', category=DeprecationWarning)
# load pytraj
import pytraj as pt
In [2]:
%matplotlib inline
%config InlineBackend.figure_format = 'retina'  # high resolution
import matplotlib
from matplotlib import pyplot as plt
In [3]:
# load trajectory
traj = pt.load_sample_data('tz2')
traj
Out[3]:
In [4]:
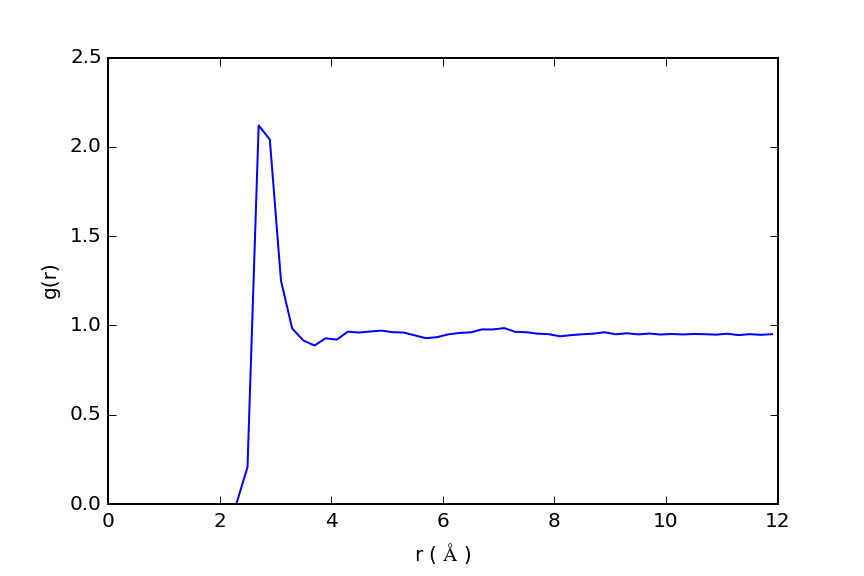
# perform RDF calculation for water

rdf_data = pt.rdf(traj, solvent_mask=':WAT@O', solute_mask=':WAT@O', bin_spacing=0.2, maximum=12.)
In [5]:
rdf_data
Out[5]:
In [6]:
plt.plot(rdf_data[0], rdf_data[1])
plt.xlabel(r"r ( $\AA$ )")
plt.ylabel('g(r)')
#plt.savefig('rdf_tz2_ortho.png')
Out[6]:

(radial_distribution_function_of_water.ipynb; radial_distribution_function_of_water_evaluated.ipynb; radial_distribution_function_of_water.py)