try pytraj online:
Plot correlation matrix
In [1]:
# require: matplotlib, seaborn, pytraj
# how? "conda install matplotib seaborn"

import warnings
warnings.filterwarnings('ignore', category=DeprecationWarning)

%matplotlib inline

# add matplotlib and seaborn package
# http://matplotlib.org/
from matplotlib import pyplot as plt

# https://stanford.edu/~mwaskom/software/seaborn/index.html
import seaborn as sns

# use pytraj
import pytraj as pt

# call matrix module
from pytraj import matrix

# load trajectory from file
traj = pt.iterload('tz2.nc', 'tz2.parm7')
traj
Out[1]:
In [2]:
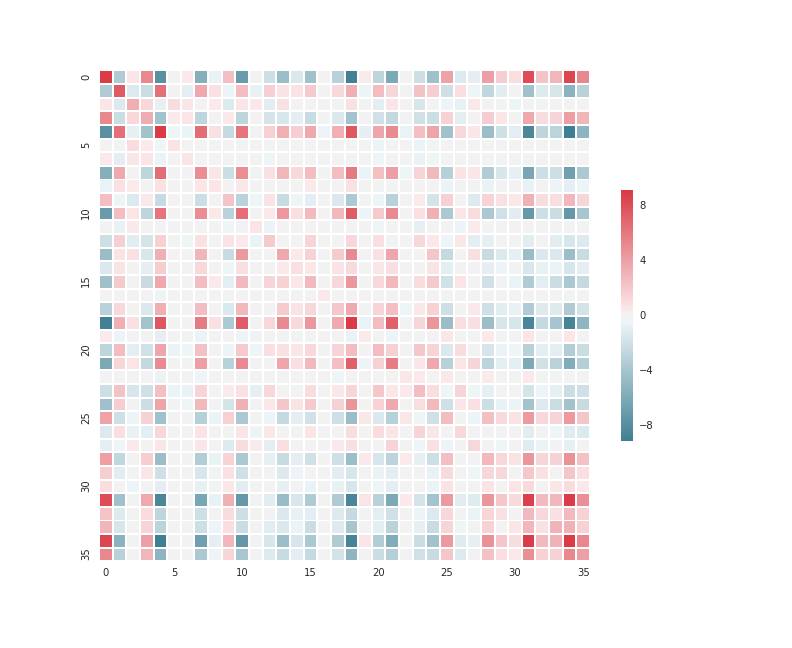
# calculate coordinate covariance matrix
mat = matrix.covar(traj, '@CA')
In [3]:
mat
Out[3]:
In [4]:
# adapted from: https://stanford.edu/~mwaskom/software/seaborn/examples/many_pairwise_correlations.html
# Set up the matplotlib figure
f, ax = plt.subplots(figsize=(11, 9))

# Generate a custom diverging colormap
cmap = sns.diverging_palette(220, 10, as_cmap=True)

# Draw the heatmap with correct aspect ratio
sns.heatmap(mat, cmap=cmap, vmax=.3,
            square=True, xticklabels=5, yticklabels=5,
            linewidths=.5, cbar_kws={"shrink": .5}, ax=ax)
#plt.savefig('matrix_covar.png')
Out[4]:

(plot_correlation_matrix.ipynb; plot_correlation_matrix_evaluated.ipynb; plot_correlation_matrix.py)