Pairwise RMSDΒΆ

try pytraj online:

http://mybinder.org/badge.svg

../_images/plot_pairwise_rmsd.png

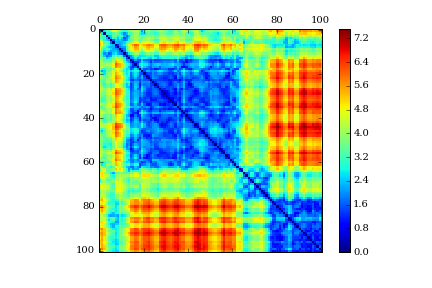
Calculate pairwise RMSD for trajectory and plot

In [1]:
import warnings
warnings.filterwarnings('ignore', category=DeprecationWarning)

import pytraj as pt
from pytraj.plot import plot_matrix
In [2]:
traj = pt.iterload("tz2.nc", "tz2.parm7")
In [3]:
mat = pt.pairwise_rmsd(traj, '@CA')
mat
Out[3]:
array([[ 0.        ,  2.54596877,  4.2233305 , ...,  4.97189569,
         5.53947735,  4.83201218],
       [ 2.54596877,  0.        ,  2.65172958, ...,  5.49644947,
         5.88539743,  5.16797924],
       [ 4.2233305 ,  2.65172958,  0.        , ...,  5.15554571,
         5.26414633,  4.74179935],
       ..., 
       [ 4.97189569,  5.49644947,  5.15554571, ...,  0.        ,
         1.63137424,  1.0441432 ],
       [ 5.53947735,  5.88539743,  5.26414633, ...,  1.63137424,
         0.        ,  1.31550694],
       [ 4.83201218,  5.16797924,  4.74179935, ...,  1.0441432 ,
         1.31550694,  0.        ]], dtype=float32)
In [4]:
%matplotlib inline
%config InlineBackend.figure_format = 'retina' 
import matplotlib

fig, asp, axi, = plot_matrix(mat)
fig.colorbar(axi, ax=asp)

# from matplotlib import pyplot as plt
# plt.savefig('plot_pairwise_rmsd.png')
Out[4]:
<matplotlib.colorbar.Colorbar at 0x10ac137f0>

(pairwise_rmsd.ipynb; pairwise_rmsd_evaluated.ipynb; pairwise_rmsd.py)