Ramachandran plot
try pytraj online:
Aim 1
- download pdb file
- calculate phi/psi for specific residue
- show ramachandran plot
In [1]:
import warnings
warnings.filterwarnings('ignore', category=DeprecationWarning)

# do some configs to get better plot
%matplotlib inline
#%config InlineBackend.figure_format = 'retina'
import matplotlib
from matplotlib import pyplot as plt

import numpy as np
import pytraj as pt
In [2]:
traj = pt.datafiles.load_trpcage()
print(traj)
print(set(res.name for res in traj.top.residues))
In [3]:
# calculate phi/psi for Gly residues
# need to get indcies of Gly residues
indices = [idx for idx, res in enumerate(traj.top.residues) if 'GLY' in res.name]
print('Gly resdiue indices = ', indices)

dataset = pt.multidihedral(traj, 'phi psi', resrange=indices)
print(dataset)
In [4]:
# take data for 'phi' and flatten to 1D array
phi = np.array([d.values for d in dataset if 'phi' in d.key]).flatten()

# take data for 'psi' and flatten to 1D array
psi = np.array([d.values for d in dataset if 'psi' in d.key]).flatten()

# setup color
colors = np.random.rand(len(psi))

plt.xlim([-180, 180])
plt.ylim([-180, 180])
plt.xlabel('phi')
plt.ylabel('psi')
plt.grid()
plt.scatter(phi, psi, alpha=0.5, c=colors)
Out[4]:

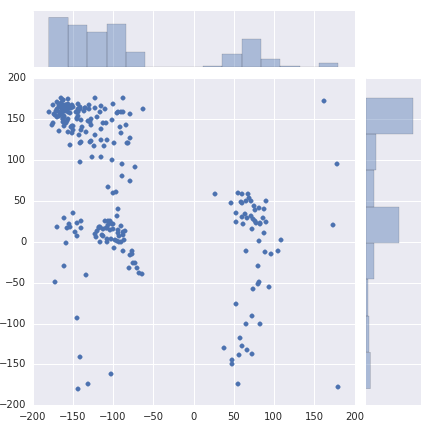
Aim 2: plot phi/psi for Ala residue
In [5]:
traj = pt.iterload('ala3.dcd', 'ala3.psf')
print([res.name for res in traj.top.residues])
In [6]:
traj
Out[6]:
In [7]:
# only plot for residue 2 (python uses 0-based index)
phi, psi = pt.multidihedral(traj, resrange=[1,], dihedral_types='psi phi')
phi, psi
Out[7]:
In [8]:
from matplotlib import pyplot as plt
import seaborn as snb
In [9]:
snb.jointplot(phi, psi, kind='scatter', stat_func=None)
#plt.savefig('phipsi_ala3.png')
Out[9]:

(plot_phi_psi_trpcage.ipynb; plot_phi_psi_trpcage_evaluated.ipynb; plot_phi_psi_trpcage.py)